 News
News  Market Data
  Discover
Support: 888-992-3836
Copyright © 2023 InvestorsHub Inc.


Register for free to join our community of investors and share your ideas. You will also get access to streaming quotes, interactive charts, trades, portfolio, live options flow and more tools.
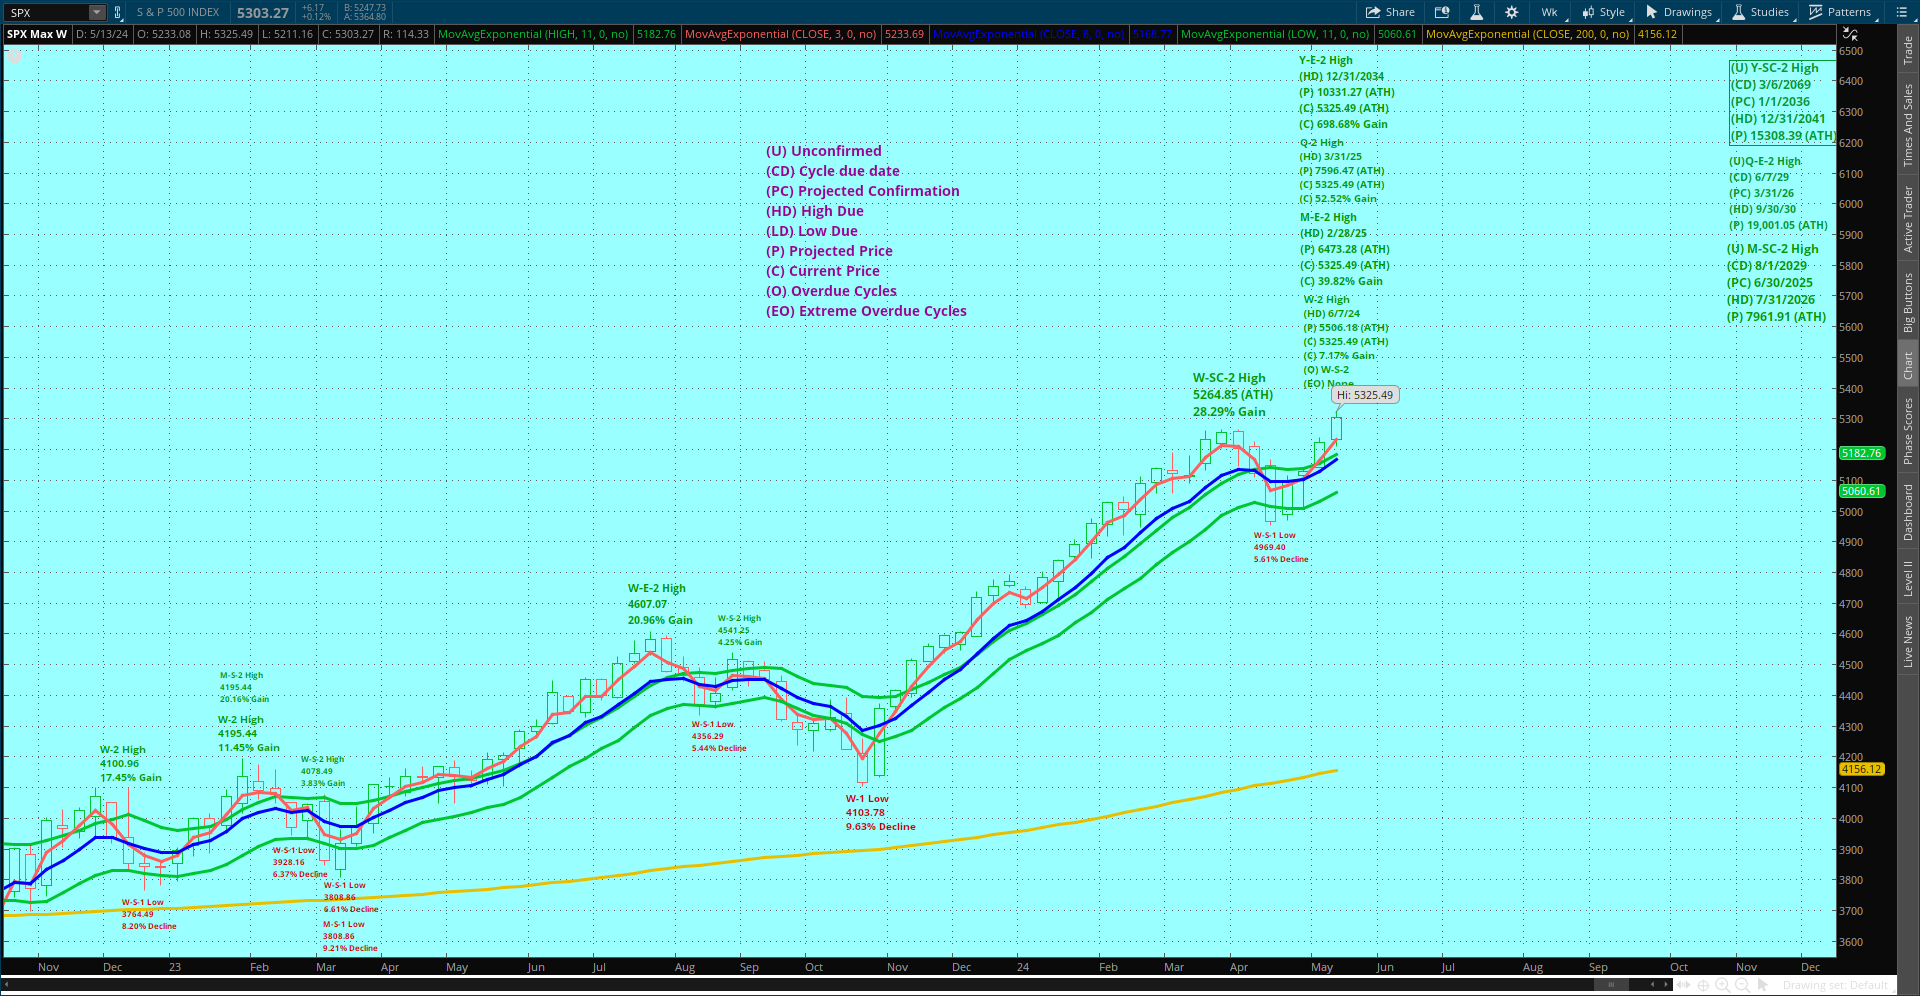
SPX Cycles Long Range Projection Chart. Today at the close the Weekly confirmed a W-2 (Overdue) projected high 5506.18, the high is due 6/7/24.
Now maybe they are going to ramp the last hour or at least into the close...This should cause the market to go down.::)
https://schrts.co/JyTaYKvM
OK will try more down then...5271 is the 60 min target, the 34MA
https://schrts.co/zmnxRbES
So efar just poked it;s head above the top DT line and then back inside the Bull Flag..? So just have to see what happens next..I thought a up move if it broke out.?
https://schrts.co/eJJIBfiJ
The 15 min SPX BB are tightening.. Best guess is we break up out of this bull fomation shortly??
https://schrts.co/TzGMZWJu
Glen
Pretzel Update: Not much added today, he thinks this has further to go........... Wave 4 down followed by a wave 5 up............. we'll see of course going forward.
https://investorshub.advfn.com/boards/read_msg.aspx?message_id=174440886
SPX .....15.....Very good excellent charts......thank you. GLEN .....PL...can you post the same chart in daily Time frame ...thanks..
https://schrts.co/IuFVInIK
This could possibly be a Bull Flag formation.??
https://schrts.co/IuFVInIK
$SPX.....10....Daily trend LL.... can change ?....yes can..
https://schrts.co/DAgGMrDZ
$SH 10........Look like a bear day ...second day.....daily trend HH...OPINION
https://schrts.co/gnqSYupm
This Bull Flag which took a month to complete was the Bottle Rocket which caused this huge ramp after the breakout. So looks like I need to pay attention to patterns as this. I usually catch the 4 or 5 day ones...But sure missed this Monthly one.
https://schrts.co/iIRStpZV
SPX Cycles Long Range Projection Chart. Today the SPX made a new ATH at 5325.49. Again the Weekly, Monthly, Quarterly & Yearly cycles put in new cycle highs at 5325.49. Tomorrow at the close the Weekly is expected to confirm a W-2 (Overdue) projected high 5506.18, the high will be due 6/7/24.
5265 is the 4 hour SPX target, the 10EMA
https://schrts.co/WSbSTCXZ
Finally exceeded the 60 min 10EMA target..So got one right today..Better not make another call today tho..
https://schrts.co/fmrnxqpJ
Almost...::) The 10EMA moved down at 5303 so my 5305 level was hit but did not hit the 10EMA yet,,
5305 is the 60 min SPX target...Give it another try today..We could also be basing for another rampo. Just have to see.
https://schrts.co/vCYmnqVF
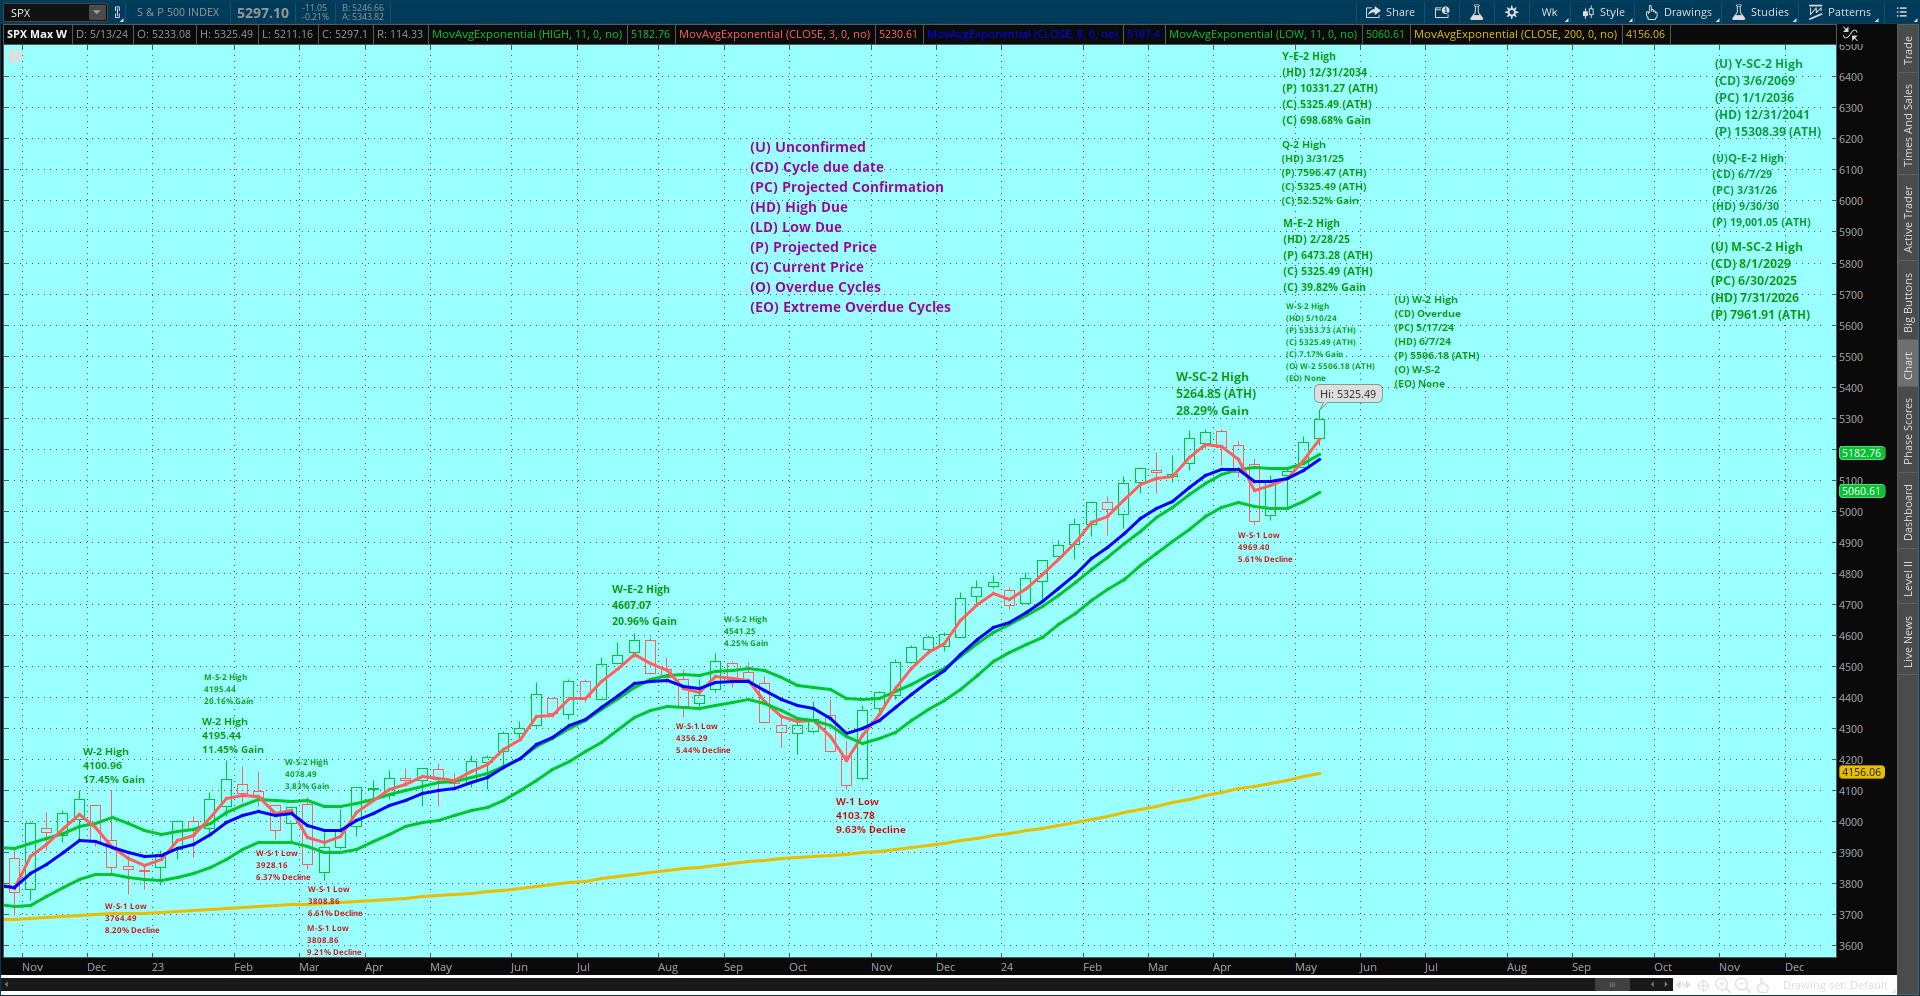
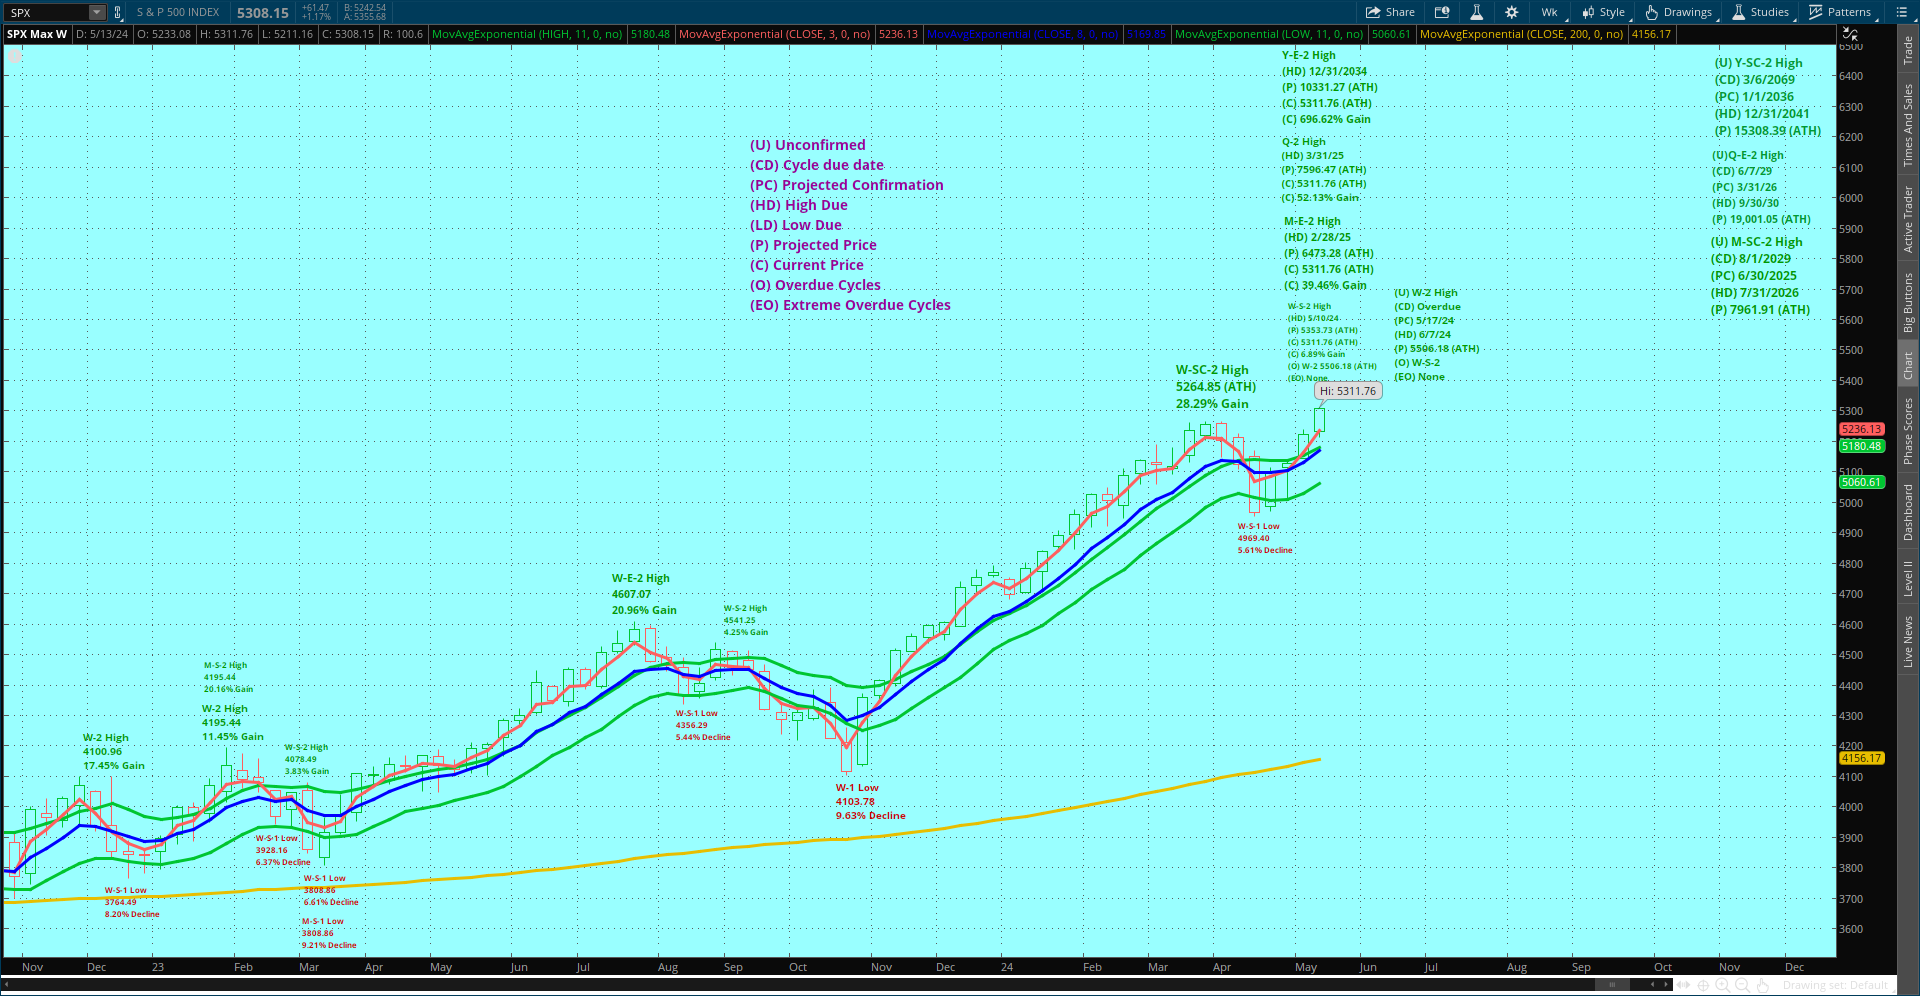
SPX Cycles Long Range Projection Chart. Today the SPX put in a ATH at 5311.76 and the Weekly, Monthly, Quarterly & Yearly cycles all put in new cycle highs at 5311.76. The Weekly is expected to confirm a W-2 (Overdue) at the close on Friday with a projected high of 5506.18, the high will be due 6/7/2024.
5274 is the 60 min SPX target, the 10EMA...JUst have to see if the Bull have had enough here.?
https://schrts.co/IHBMYeFv
Glen
Pretzel update: Pretzel has a pretty good sense of humor and i would say its on full display today
https://investorshub.advfn.com/boards/read_msg.aspx?message_id=174422434
Probably no need to say, but ALL my Down signals have been negated...
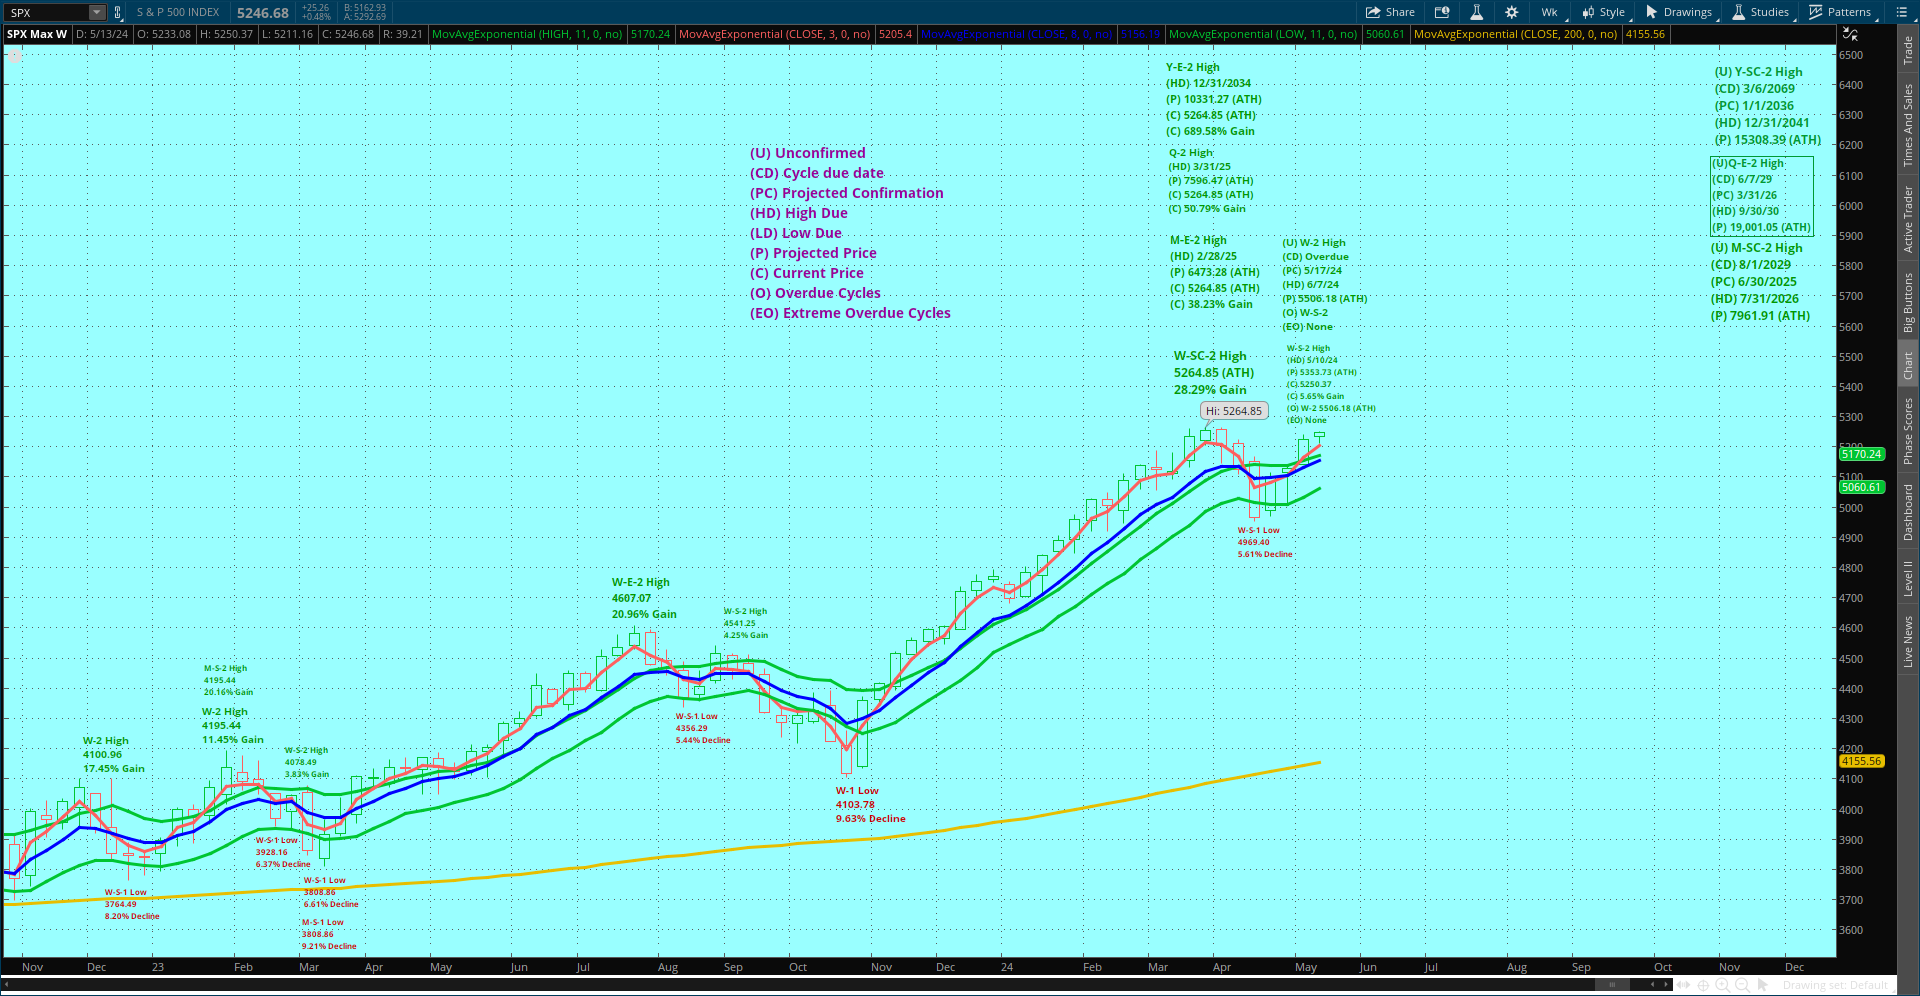
SPX Cycles Long Range Projections Chart. Today the Weekly W-S-2 put in a new cycle high at 5250.37, the projected high is 5353.73 (ATH). It's looking like the Weekly W-2 (Overdue) will get confirmed at the close on Friday with a projected high of 5506.18 (ATH), the high will be due 6/7/24.
$SPX.....10......2x15......2Ds....Heikin -.Ashi
10.
https://schrts.co/zuuDmzQY
1-15.
https://schrts.co/eqpVBpzc
2-15...
https://schrts.co/fSqStXie
$SPX....60.....+Daily...........Weekly.. trend HH now
60....... S...5211.16
https://schrts.co/PYBhMtcD
Daily........KEEP YOUR EYES AT Support at RED bar under.5211.xx.......may hit it....OPINION
https://schrts.co/CzJUgYeS
weekly.
https://schrts.co/Yarnvyrq
4854 is the Monthly SPX target, the 10EMA..Looks like a long way down from here. So if we do hit the target it will take a while..Most likely.
https://schrts.co/AuVgqwCH
5205 is the 4 hour SPX target, the 10 EMA..
The Daily SPX target remains the 10EMA now at 5177...JUst have to see..
Thanks RCKS..Sure not much encouragement for the bears right now. One guru I read is still looking up but no final target yet.,But I know he is looking at over 5300
5199 is the 4 hour SPX target, THE 10ema
https://schrts.co/VEYtcIfY
The SPX has hit the 60 min 10EMA target and has exceeded it.In fact SPX went down to the 60 min 20MA before starting a bounce. Needs to remain below 5122 for possible more down.
https://schrts.co/ypCqWHRN
$NYAD.....30...........DAMPS...13.00PM
https://schrts.co/bAxbMMpX
$UPRO.........15.............D...TREND LL......
https://schrts.co/jCMdqUIg
$SDS...15...............25.35.....Daily trend HH.......13.00P
https://schrts.co/rIGDmzNc
Glen
Pretzel Update May 13, 2024: Nothing new added today, just onward and maybe upward.......
https://investorshub.advfn.com/boards/read_msg.aspx?message_id=174406770
$SPX.......15............. ..
Note 15 find a support at BB50 center line now.....will see if HOLD....for the EO.D ???
https://schrts.co/qKKhHZEd
$SPX......30.....60.....Daily.....Fail this morning daily trend HH......[color=red]maybe w8dn...if you see RED..? day or also FAIL Week..HH now..??..[/color]
D.
https://schrts.co/QrUNIWjj
30
https://schrts.co/UpbAqsVh
60.
https://schrts.co/xiExZtcH
$TZA......30.....Will fill today GAP......??....may looking for daily trend HH....?? OPINION....
https://schrts.co/RTuzyQYQ
5221 is the 60 min SPX target, the 10EMA
https://schrts.co/sXpNYwBw
5168 is the Daily SPX target, the 10EMA
https://schrts.co/BXSXFSVF
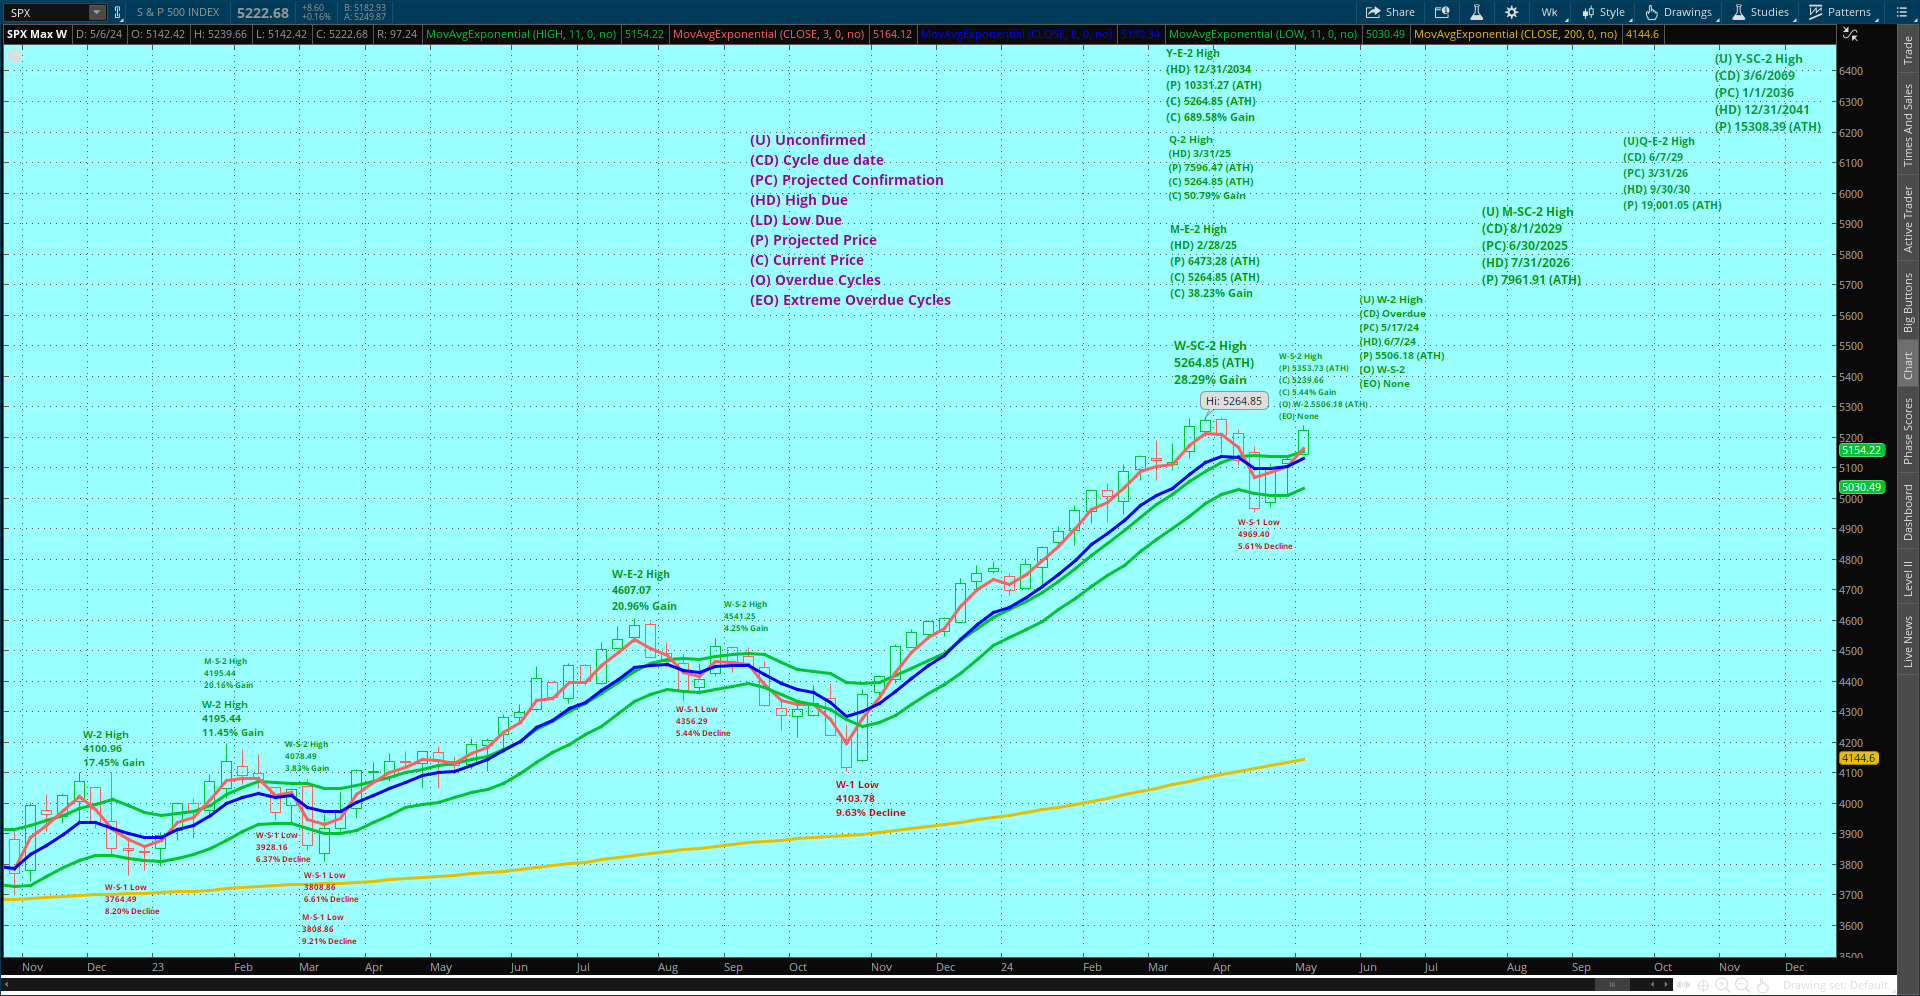
SPX Cycles Long Range Projection Chart. The Weekly W-S-2 put in another cycle high at 5239.66. Next week there is the possibility of a W-2 (Overdue) getting confirmed at the close on Friday, projected high 5506.18, the high will be due 6/7/24.
VGK Daily....Europe...trend HH...with GAP.......rsi14 hit above 70.55 now...look like...
https://schrts.co/VBcADSXh
$VIX....10.......daily trend LL now.....Maybe will hit as target.....12.40...??......OPINION
https://schrts.co/ZPDmaXZB
$SPX.........Daily trend HH...MAYBE 7up....extended .with bar color as is Green now .......look if change to RED .end of the day........may not...?
H.line ...present the open market today. . .the at the BAR monitor...above or below.this mark..E.O.D...today..
https://schrts.co/qZFrTANc
Possibility of 60 min 60-SC-2 at the opening of the 6th hour and a Daily D-E-2 at the close today.
If the 60-SC-2 is confirmed a UPRO Sell Signal becomes active, target price 72.93
$NYAD.....30....... Look like 8C=down.or up..day ???...OPINION....
https://schrts.co/cbZKnTGN
$XLF.....15....D......daily trend HH... Market BOOSTER OPINION
https://schrts.co/YHSRmUxc
$TNA 15....... Wild Horse....
https://schrts.co/qzPDjBSp
$UDOW.....15....30.....D...Trend HH.....NEED TO FILL GAP ....NEXT up or down....???
15....
https://schrts.co/HIVjAfbf
30.
https://schrts.co/edVejitt
Thanks RCKS. I read two big guru's every day.Now one is looking at more up and the other is looking for down to start any time. Says the high is in. JUst see who will be right. I sure as heck do not know. Just seem to keep going up.
Glen's system:
For this system, I use the 10EMA, 20SMA, 34SMA,50SMA,100SMA, 140SMA and the 200SMA.
I use CCI10,20,34,60 and 100..
The system hit targets more often when going with the trend...
The targets are for the MA's at the time they are called and the actual target price when hit may be slightly different depending on how long it takes and how steep the MA's are moving..Each time frame update will also change the value of the MA.
So here is the way it works..Starting from a top...This works in ALL time frames from the 1 min to the monthly..
When CCI10 drops back below +100 price moves to the 10EMA
When CCI10 crosses below zero price moves to the 20MA
When CCI20 crosses zero price moves to the 34MA
When CCI34 moves below zero price moves to the 50MA
When CCI60 crosses zero price moves to the 100MA
When CCI100 crosses zero price moves to the 140MA
When CCI100 crosses below -100 price moves to the 200MA.
When CCI272 crosses zero price goes to the 320MA.
when price gets above all the MA's I use then you move to the next longest timeframe for targets and signals
Then you just start the system in reverse when CCI10 moves back above -100..
* After price gets above all the MA's on every time frame then you can not call any more up targets.(Monthly Chart is the longest)....You have to wait for CCI10 to drop back below +100 for a down signal on any timeframe.
** Use same instructions in reverse for opposite direction market movements
*** In strong market moves, countertrend moves will be difficult to hit
| Volume | |
| Day Range: | |
| Bid Price | |
| Ask Price | |
| Last Trade Time: |


